Pseudo R squared measures for non-linear models
Confusion surrounds pseudo R squared measures, this post alleviates that confusion

The R2 statistic, or the coefficient of determination, is a statistical measure used to assess the proportion of variance in the dependent variable that can be explained by the independent variable. In other words, it provides an estimate of model fit. The purpose of R2 becomes slightly harder to understand in a non-linear context. Instead of stating plainly that 56 per cent of the variance can be explained through this analytical model, a non-linear R2 statistic provides a more general guideline of model fit. In a non-linear context the R2 becomes the pseudo R2. This post seeks to outline the most common and provide relevant critiques for each.
There are several pseudo-R2 statistics to choose from, but no one appears to have a consensus on which is best or most appropriate to use (Allison, 2013). Previous empirical work on the different measures of R2 statistics has demonstrated that for the same model, different measures produce wildly different pseudo R2 (Smith and McKenna, 2013). Four common pseudo R2 that are used are McFadden’s R2 and adjusted R2 (McFadden, 1972), the Nagelkerke R2 (Nagelkerke, 1991), as well as the Cox-Snell R2 (Cox and Snell, 1989), amongst others. For a linear model, the R2 statistic represents the proportion of variance in the dependent variable that can be explained by the independent variables in an ordinary least squares regression model. An R2 of 0.4 in this regard would represent 40 per cent of the variance being explained. is defined as:

For non-parametric models, the R2 becomes slightly more difficult to interpret; for logistic-based regression, the estimator is maximising the likelihood function. There is no ‘true’ measure of R2 in a non-linear model. However, the proportion of unaccounted-for variance that is reduced by adding variables to the model is the same as the proportion of variance accounted for or R2. All four pseudo R2 statistics use this general logic to construct their variations of R2. The interpretation of a pseudo-R2 differs from its linear regression counterpart due to the limits placed upon a logistic or multinominal pseudo-based measure. Whilst the pseudo-R2 shares with the R2 the rule that the limit tends to increase as the absolute value of beta increases with other parameters that are fixed. There is a difference in the proportion that these limits increase by, with pseudo-R2 measures increasing at a lower rate than linear counterparts, even when the associations are strong (Hu, Shao and Palta, 2006). Four pseudo R2 are presented below.
McFadden’s R2 is defined as:
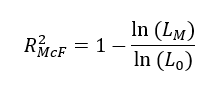
Where L0 is the value of the likelihood function for a model with zero predictors and LM is the likelihood of the model being estimated. The L0 is analogous to the residual sum of squares in an OLS regression - analogous to SSRes. McFadden’s R2 is the simplest non-linear statistic on offer as all it uses the the log-likelihood function. The major critique of the McFadden R2 is that each additional parameter added to a given non-linear model will increase the R2 statistic.
To deal with this critique, McFadden’s adjusted R2 penalises additional parameters. It is defined as:

Where K is the number of estimated parameters in the model. The adjusted version of McFadden’s R2 penalises the R2 as more parameters are added to the model, making it an attractive option to use.
The Cox-Snell R2 (also known as the maximum likelihood ) offers an alternative calculation of pseudo-R2 and is calculated as:

Where n is the sample size and -GM represents the negative likelihood ratio chi-square statistic and N the total number of observations. The Cox-Snell R2 can be calculated for both linear or non-linear models – the equation is identical. This makes it an attractive measure if there is a desire for uniformity across analyses. As Allison states, this R2 is more appropriately termed a ‘generalised’ rather than ‘pseudo’ R2 because the usual R2 used in linear regression depends on the likelihoods for the models without predictors by this formula (Allison, 2013). The Cox-Snell R2 is very attractive as it is consistent with linear R2 measures, is consistent with maximum likelihood as an estimation method, is asymptotically independent of the sample size n, and has an interpretation of explained variation (Nagelkerke, 1991).
The major issue with the Cox-Snell R2 however is that it has an upper bound of less than 1.0 and is dependent on the margin proportion of cases within events – this means that the upper bound of a given model can be a lot less than 1.0 or very close to it, depending on the marginal proportion of cases within events. This makes the Cox-Snell R2 much less attractive than first thought.
A solution to this presented by Nagelkerke, that is to divide the R2 by its upper bound. The Nagelkerke R2 (also known as the Craig and Uhler R2) is defined as:
However, this ‘solution’ is ad hoc. This R2 also tends to obtain the highest R2 statistic out of all pseudo methods.
Each of these pseudo R2 measures present certain issues. Following the advice from Allsion (2013) the Tjur R2 measure, or as Tjur calls it, the coefficient of discrimination (Tjur, 2009) appears to be the best R2 measure for use of interpretation in logistic regression models. The Tjur R2 measure is defined as:
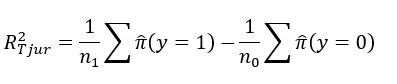
It is the difference between the average fitted probability for the binary outcome coded to 1 (success level) and the average fitted probability for the binary outcome coded to 0 (the failure level).
The Tjur R2 measure has an upper bound limit of 1.0 and is very similar to the linear R2 estimation, as it is calculated for each category of the dependent variable, calculated the mean of the predicted probabilities of an event, then take the difference between the two means. The Tjur R2 is equal to the arithmetic mean of two R2 formulas based on squared residuals and equal to the geometric mean of two other R2 formulas based on square residuals (Allison, 2013). Whilst there is no automatic output for this R2 measure in Stata, it can be accomplished by after running a regression, running the predict command on an e(sample) and then getting the difference in means from a ttest.
The Tjur R2 is not linked to the likelihood function and as a result adding additional variables to the model could result in a decline in the overall . This is a benefit rather than a detriment to the measure. This allows for a better comparison of predictive potential for model building. A major issue with the Tjur R2 is that it can’t be readily applied to an ordinal or multinominal logistic regression.
Whilst no single pseudo R2 measure appears perfect, two seem to have the least criticisms. The McFadden Adjusted R2 and the Tjur R2 offer the most practical solution for a non-linear pseudo R2 measure without the baggage that appears to occupy other non-linear measures. I would advice using both when possible when conducting non-linear based measures. Ultimately, the practicality in most software packages means that providing all R2 measures mentioned here would take no time at all. All except the Tjur R2 measure can be produced using the ‘fitstat’ command in Stata, and the former measure can be produced with a predict and ttest. All measures should be included within the analysis - though McFadden’s adjusted R2 or Tjur’s R2 measure should be primarily reported.
Note: This post was partly inspired by Allison’s wonderful series on R2 measures. The point of this post was to update and provide my own views on the matter.
References:
Allison, P., 2013. What’s the best R-squared for logistic regression. Statistical Horizons, 13.
Cox, D.R. and Snell, E.J. (1989) Analysis of Binary Data. 2nd Edition, Chapman and Hall/CRC, London.
Hu, B., Shao, J. and Palta, M., 2006. Pseudo-R 2 in logistic regression model. Statistica Sinica, pp.847-860.
McFadden, D., 1972. Conditional logit analysis of qualitative choice behavior.
Nagelkerke, N.J., 1991. A note on a general definition of the coefficient of determination. biometrika, 78(3), pp.691-692.
Smith, T.J. and McKenna, C.M., 2013. A comparison of logistic regression pseudo R2 indices. Multiple Linear Regression Viewpoints, 39(2), pp.17-26.
Tjur, T., 2009. Coefficients of determination in logistic regression models—A new proposal: The coefficient of discrimination. The American Statistician, 63(4), pp.366-372.